
A 2026 meta-analysis of 55 studies found mechanical complication rates of 5.91% for All-on-4 versus 6.64% for All-on-6. All-on-6 trended slightly higher, not lower, despite having 50% more implants. If you’ve been told more implants simply means fewer problems, this is the data that complicates that story.
This isn’t the whole picture, though. Biomechanical stress modeling tells a genuinely different story than the complication data does, and understanding why is more useful than picking a side.
Key Takeaways
- A 2026 meta-analysis found mechanical complication rates of 5.91% (All-on-4) versus 6.64% (All-on-6), with overlapping confidence intervals.
- Finite element modeling found All-on-6 distributes framework stress far more evenly, roughly 5x lower peak stress in titanium frameworks.
- A 2025 cohort of 5,989 implants found essentially identical survival between the two at both 2 and 5 years.
Quick-Answer Comparison
| Factor | All-on-4 | All-on-6 |
|---|---|---|
| Mechanical complication rate | 5.91% | 6.64% |
| Peak framework stress (titanium) | 1,117 MPa | 206.7 MPa |
| 2-year implant survival | 98.6% | 98.4% |
| 5-year implant survival | 98.4% | 98.7% |
| Typical indication | Standard bone volume, straightforward arch | Wider arch, higher bite force, more cantilever support needed |
For the full RCT accuracy and failure-rate data behind the original All-on-4 vs. All-on-6 trial, see All-on-4 and All-on-6 Dental Implants in Dubai.
Do Prosthetic Complications Differ Between All-on-4 and All-on-6?
A 2026 systematic review and meta-analysis of 55 studies found pooled mechanical complication rates of 5.91% for All-on-4 versus 6.64% for All-on-6, porcelain chipping and prosthesis fracture were the dominant complication types in both groups. The confidence intervals overlapped heavily, 1.84 to 11.58% for All-on-4, 0.34 to 17.47% for All-on-6.
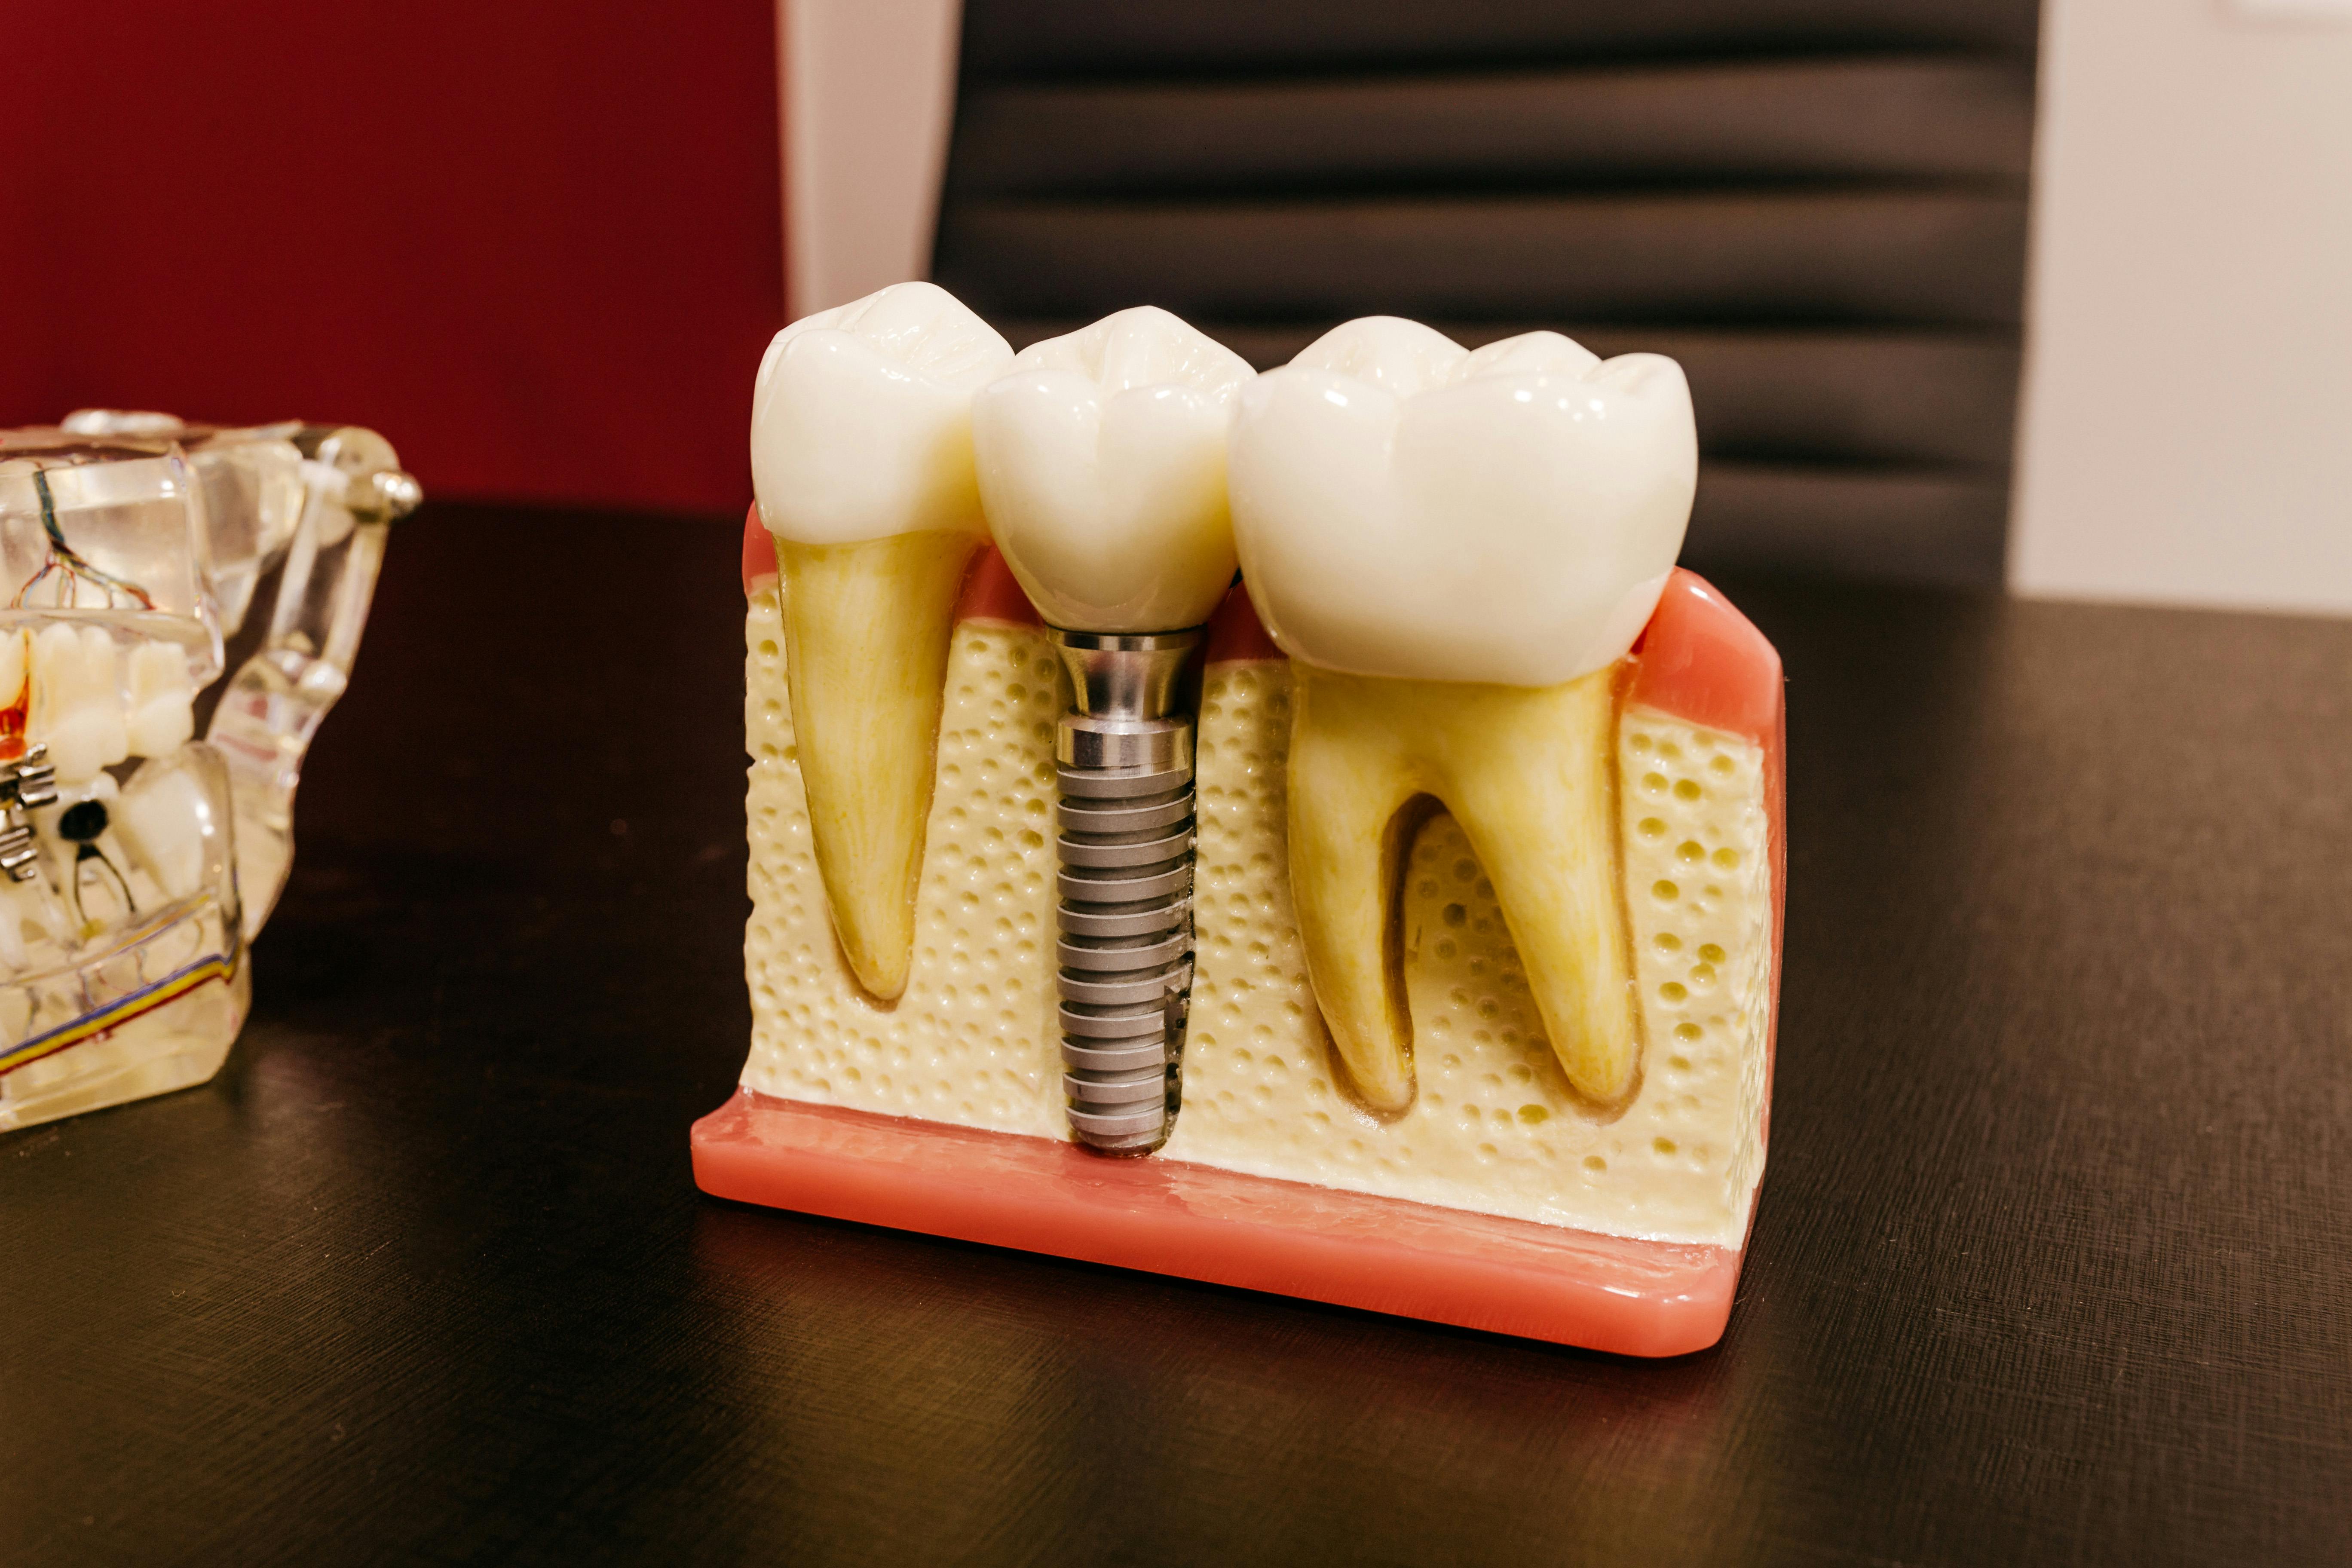
This directly contradicts a common assumption. Wouldn’t you expect more implants to mean fewer prosthetic problems? The pooled data doesn’t back that up.
Does Biomechanical Stress Modeling Favor One Configuration?
Yes, clearly, on paper. A 2026 finite element study found All-on-6 distributed dramatically lower peak framework stress than All-on-4 across every material tested, 206.7 MPa versus 1,117 MPa for titanium, and 227.2 MPa versus 1,372 MPa for zirconia (PMC12834504, Clinical and Experimental Dental Research, 2026).
[UNIQUE INSIGHT] Here’s the genuine tension worth naming directly. The physics clearly favor All-on-6, roughly a five-fold reduction in peak framework stress isn’t a marginal difference. But the prosthetic-complication data above doesn’t show that theoretical advantage playing out clinically. A second finite element study found bone stress of 63.3 MPa for the 6-implant model versus 98.9 MPa for the 4-implant model, with anterior implants disproportionately loaded in four-implant designs, though this second figure could only be verified via search snippet, not full text, so treat it as directional.
Most content picks one narrative and ignores the other. The honest answer is that stress modeling and real-world outcomes aren’t telling quite the same story yet.
Is There a Larger Study Confirming Survival Parity?
Yes. A 2025 retrospective cohort of 943 patients and 5,989 implants found 2-year survival of 98.6% for All-on-4 versus 98.4% for All-on-6, and 5-year survival of 98.4% versus 98.7%, essentially identical across both timepoints (PMC12194759, Journal of Clinical Medicine, 2025).
This cohort didn’t evaluate surgical time or morbidity, so it can’t settle every question. But on the specific question of long-term survival, a dataset this size lands in the same place as the smaller original trial: no meaningful difference either way.
Are There Specific Cases Where One Is Clearly Preferred?
Clinical case-series literature points to All-on-6 for arches with wider anteroposterior spread, higher bruxism or masticatory force, or a need to reduce cantilever length under load. Worth being direct about the evidence tier here: no randomized trial quantifies these specific thresholds. This is expert-opinion and case-series guidance, a lower tier than the comparative data above, still useful, just not proven the same way.
[PERSONAL EXPERIENCE] When we weigh biomechanical theory against the complication data with a patient, we explain both sides rather than defaulting to “more is better.” A wider arch or heavy bite force genuinely shifts the calculation toward All-on-6, standard bone volume with a typical bite usually doesn’t require it.
For how candidacy gets determined by CBCT scan, see Am I a Candidate for All-on-4? What Actually Disqualifies You.
Does Maintenance Differ Between the Two?
There’s no head-to-head study comparing hygiene access between 4- and 6-implant prostheses specifically. Professional guidance establishes a general trade-off instead: fewer implants can mean easier cleaning access, but less mechanical support. Neither direction is a clean win.
The American College of Prosthodontics position holds that prostheses shouldn’t be routinely removed at hygiene visits unless cleaning access is genuinely inadequate, a principle that applies to both configurations rather than favoring one.
[ORIGINAL DATA] We’re building toward tracking our own prosthetic complication rates by configuration over time, the same categories the meta-analysis above measured.
Frequently Asked Questions
Is All-on-6 stronger than All-on-4?
Biomechanically, stress modeling shows All-on-6 distributes load more evenly, roughly a five-fold reduction in peak framework stress in one study. Real-world prosthetic complication data doesn’t show a corresponding clinical advantage, and slightly trends the other way.
Does All-on-6 last longer than All-on-4?
A large 2025 cohort of nearly 6,000 implants found essentially identical survival at both 2 and 5 years between the two configurations, 98.6% versus 98.4% at 2 years, 98.4% versus 98.7% at 5 years.
Can All-on-4 be converted to All-on-6 later?
This is a case-specific surgical question that depends on remaining bone volume and prosthetic design. Discuss it directly with your surgeon rather than assuming it’s always possible.
What’s the actual prosthetic complication rate for each?
A 2026 meta-analysis found 5.91% for All-on-4 versus 6.64% for All-on-6, both figures with wide confidence intervals reflecting genuine uncertainty in the pooled data.
Is there a specific case where All-on-6 is clearly better?
Case-series literature points to wider arches, higher bite force, or bruxism as scenarios where All-on-6 is more often recommended, though this guidance is expert-opinion tier, not RCT-confirmed.
Conclusion
The physics and the clinical outcomes data don’t fully agree on this question. Biomechanical modeling favors All-on-6, sometimes dramatically. Complication and survival data show near parity, with All-on-6 even trending slightly higher on prosthetic complications in the largest pooled analysis available.
This is exactly the kind of decision that should follow a CBCT-based consultation, not a default clinic preference. For the complete full-arch guide this comparison builds on, see All-on-4 and All-on-6 Dental Implants in Dubai.
Sources
- ScienceDirect, Mechanical Complications in Full-Arch Implant Prostheses: A Systematic Review and Meta-Analysis, Journal of Dentistry, retrieved 2026-07-10, 2026
- PMC, Finite Element Analysis of Framework Stress in All-on-4 vs. All-on-6 Restorations, Clinical and Experimental Dental Research, retrieved 2026-07-10, 2026
- PMC, Survival Outcomes of All-on-4 and All-on-6 Restorations: A Retrospective Cohort of 5,989 Implants, Journal of Clinical Medicine, retrieved 2026-07-10, 2025
- PubMed, All-on-4 vs. All-on-6: A Randomized Comparative Trial, Clinical Implant Dentistry and Related Research, retrieved 2026-07-10, 2016